When viewing metrics, you’ll have the ability to view metrics from only a specific segment, if desired, by selecting the segment from the dropdown.
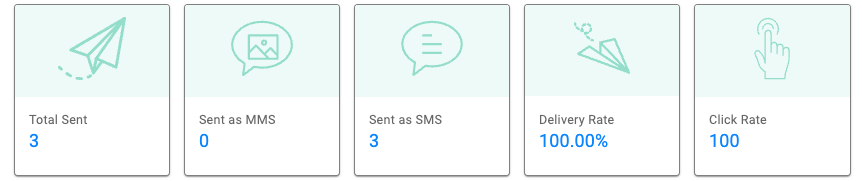
You’ll be able to view some important metrics in the summary metrics above the graph. These include:
- Total Sent
- Sent as MMS
- Sent as SMS
- Delivery Rate
- Click Rate
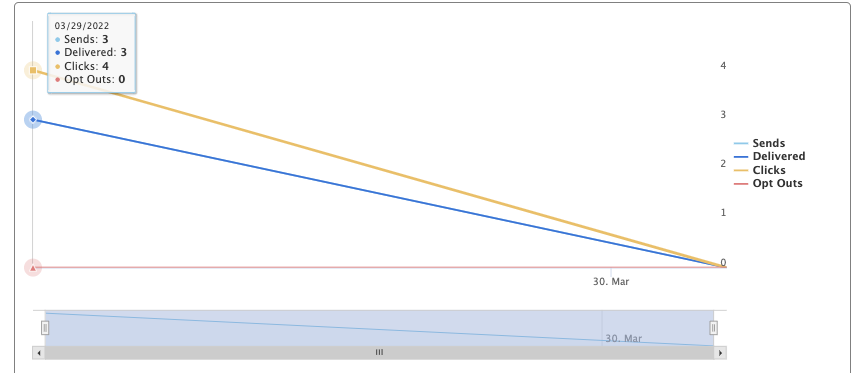
The available available metrics in this section may include the following:
- Sends
- Delivered
- Clicks
- Opt Outs
The graph will plot each metric (Sends, Delivered, Clicks, Opt Outs) by day for the reporting period. If you want to show/hide any of the legend items in the graphs, you can do so by clicking on their name. You’ll also be able to adjust the date by using the slider below the graph. Metrics display all-time performance and the chart only displays the date range in which metric activity occurred.
You’ll be able to view information on the following details:
- Send Requests
- Delivered
- Clicks
- Unique Clicks
- Opt Outs
The details will reflect information based on the segment.
You’ll be able to view information on the following rates:
- Delivered Rate (Delivered/ Send Requests)
- Click Rate (Unique Clicks/Delivered)
- Opt Out Rate (Unsubscribes/Delivered)
The rates will reflect information based on the segment.
When viewing metrics, you’ll have the ability to view metrics from only a specific segment, if desired, by selecting the segment from the dropdown.
You’ll be able to adjust the date range. The default dates show the last 6 months unless the communication was created within the past 6 months. You are only able to select dates between the communication created date and the current date.
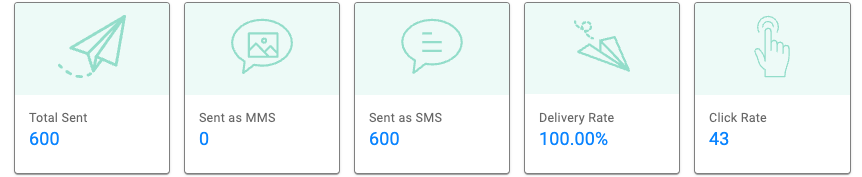
You’ll be able to view some important metrics in the summary metrics above the graph. These include:
- Total Sent
- Sent as MMS
- Sent as SMS
- Delivery Rate
- Click Rate
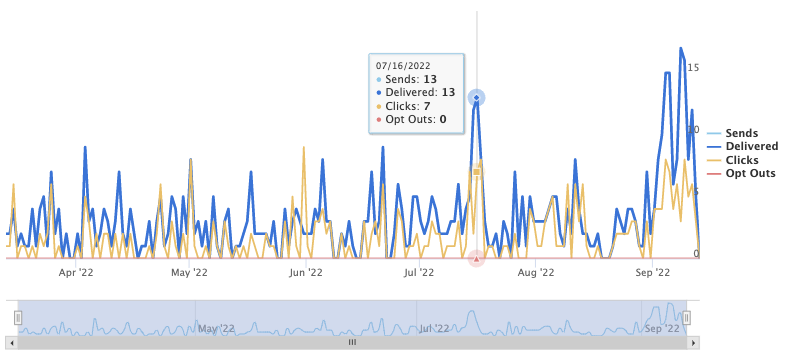
The available available metrics in this section may include the following:
- Sends
- Delivered
- Clicks
- Opt Outs
The graph will plot each metric (Sends, Delivered, Clicks, Opt Outs) by day for the reporting period. If you want to show/hide any of the legend items in the graphs, you can do so by clicking on their name. You’ll also be able to adjust the date by using the slider below the graph. Metrics display all-time performance and the chart only displays the date range in which metric activity occurred.
You’ll be able to view information on the following details:
- Send Requests
- Delivered
- Clicks
- Unique Clicks
- Opt Outs
The details will reflect information based on the segment and date range given.
You’ll be able to view information on the following rates:
- Delivered Rate (Delivered/ Send Requests)
- Click Rate (Unique Clicks/Delivered)
- Opt Out Rate (Unsubscribes/Delivered)
The rates will reflect information based on the segment and date range given.